Solvation-Mediated Free Energy Stabilization Enables Li/CFx Pouch Cells Over 800 Wh kg⁻¹ via Minimizing Heat Dissipation
Background
Maximizing the efficiency of converting chemical energy into electrical power is a fundamental challenge in electrochemistry. Although primary batteries have high theoretical energy densities, they still suffer from significant and often unexplained energy losses. The lithium/carbon fluoride (Li/CFx) system is a typical example. It provides a competitive theoretical energy density of more than 2100 Wh kg⁻¹, but its actual discharge voltage is far below its thermodynamic potential. This large voltage gap means that a considerable amount of energy is lost through non-electrochemical pathways. Conventional explanations usually focus on kinetic limitations, such as poor conductivity or sluggish C–F bond cleavage. However, the fundamental mechanism behind this energy loss has remained elusive, and most previous studies have focused on small-capacity cells.
Why the Voltage Gap Matters
A widely accepted discharge mechanism involves the formation of ternary graphite intercalation compound (GIC) intermediates. This idea comes from the observation that the open-circuit voltage (OCV) of Li/CFx batteries depends on the Gibbs free energy (ΔG) of Li⁺ in different electrolytes. In this mechanism, solvated Li⁺, surrounded by solvent molecules and anions, inserts into the CFx layers and forms a ternary C[F⁻·Li⁺·Soln] intermediate. This intermediate then disproportionates into LiF and carbon during desolvation. The two-step reaction can be expressed as follows:
CFx + Li + nSol → C(F⁻·Li⁺·Soln) → C + LiF + nSol
Here, Sol and n represent the solvent molecules and their coordination number, respectively. Experimental discharge curves show only one voltage plateau. This suggests that only one electrochemical reaction occurs in the full process. Therefore, the decomposition of the GIC intermediate is likely a chemical, non-electrochemical step.
Why Heat Dissipation Becomes a Key Issue
That chemical decomposition step generates heat. As a result, some chemical energy that could contribute to electrical output is instead lost as heat. This exothermic parasitic reaction is a major but previously underappreciated energy-loss pathway. It lowers the operating voltage and also raises thermal safety concerns. In large-capacity Li/CFx batteries, heat accumulation has become one of the main barriers to practical application.
Thermodynamically, ΔG remains constant regardless of the electrolyte environment. It can be divided into the electrochemical insertion step (ΔG₁) and the chemical decomposition step (ΔG₂). A more negative ΔG₂ directly increases heat generation and reduces the electrical energy available from ΔG₁. Since the discharge voltage depends only on ΔG₁ through the Nernst equation, minimizing heat dissipation by making ΔG₂ less negative is critical for maximizing output voltage.
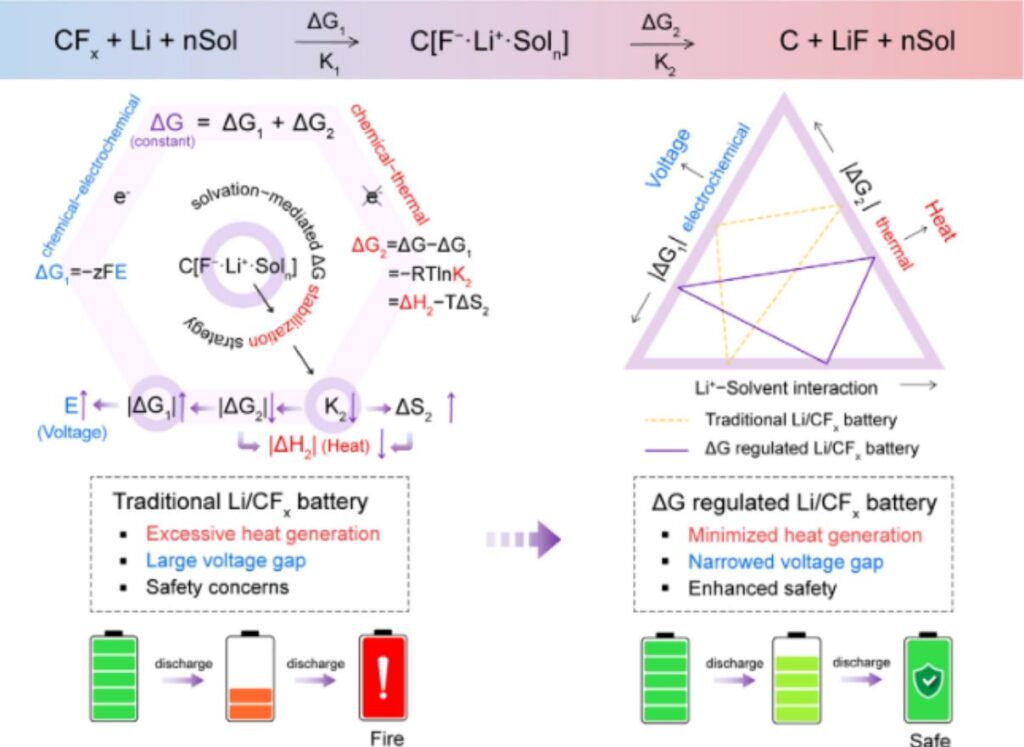
Figure 1. Thermodynamic analysis of the effects of ΔG on discharge voltage and heat generation, along with a schematic comparison between conventional Li/CFx batteries and Li/CFx batteries with solvation-regulated ΔG.
Article Highlights
The authors reported a solvation-mediated ΔG stabilization strategy that delays the decomposition of the GIC intermediate. This strategy simultaneously increases output voltage and suppresses heat generation. By designing electrolytes to strengthen Li⁺–solvent interactions, they constructed compact solvation shells. These compact structures suppress parasitic decomposition by lowering the equilibrium constant (K₂). As a result, more free energy contributes to electrical output (ΔG₁), and the discharge voltage increases. The constrained intermediate configuration also increases the entropy change of decomposition (ΔS₂), weakens the exothermicity, and thermodynamically redirects energy from heat dissipation to electrical work.
Specifically, the authors proposed two mixed-electrolyte systems that create compact Li⁺ solvation structures. Compared with conventional electrolytes such as DMC, these tailored systems reduced heat generation during discharge by 39.6%. At the same time, they raised the discharge voltage from 2.50 V to 2.92 V without sacrificing capacity. Under lean-electrolyte conditions of about 1.1 g Ah⁻¹, practical 6 Ah, 10 Ah, and 20 Ah Li/CFx pouch cells delivered 5.87 Ah, 9.68 Ah, and 19.17 Ah, respectively, at 0.01 C. Their stable voltage plateaus stayed close to 2.90 V, corresponding to record energy densities of 816, 820, and 830 Wh kg⁻¹. These values exceed previously reported CFx-based batteries and also improve thermal safety.
2. Results and Discussion
2.1 Solvent Screening for Strengthening Li⁺–Solvent Interactions
The donor number (DN) of a solvent is a key descriptor that governs Li⁺–solvent interaction and compatibility with lithium metal anodes. To establish a quantitative structure–property relationship, the authors systematically evaluated the effect of solvent DN on the stability of lithium metal in a series of organic solvents. Their experiments revealed a clear threshold near DN ≈ 30. Low-DN solvents, including DMC, PC, DME, NMP, and DMSO, showed excellent compatibility with lithium metal and maintained a mirror-like surface for more than 8 hours. In contrast, high-DN solvents such as pyridine, N-MeIM, EDA, and TEA caused immediate surface corrosion and rapid darkening. This sharp transition originates from a fundamental change in Li⁺ solvation thermodynamics.
Why DMSO and NMP Were Selected
To balance strong Li⁺ solvation with anode stability, the authors adopted a two-pronged strategy. They selected DMSO and NMP as the primary solvents because both have moderate DN values and high dielectric constants. This combination ensures sufficient salt dissociation. EDA, which has a higher DN, showed relatively poor electrochemical stability at high discharge voltages. Therefore, the authors added controlled amounts of N-MeIM and TEA to the DMSO and NMP baselines, respectively, in order to strengthen Li⁺ coordination while still maintaining chemical stability and miscibility.
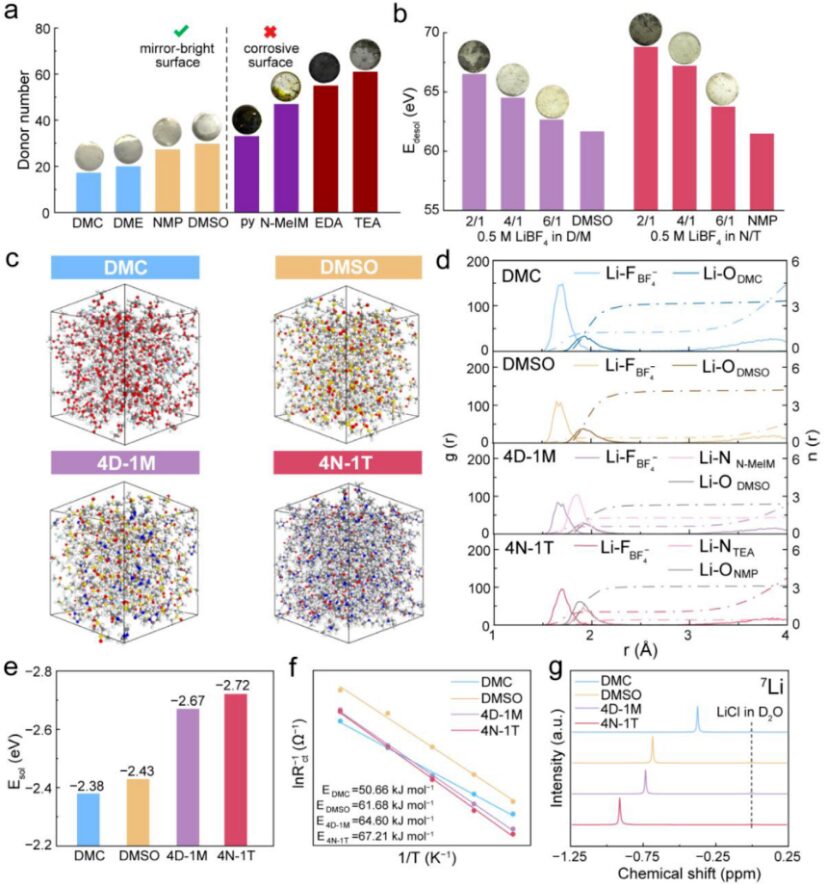
Figure 2. Solvent screening for compact Li⁺ solvation structures with strong Li⁺–solvent interactions. (a) Classification of solvents according to DN. Inset: photographs of lithium metal after soaking in different solvents for 8 h. (b) E_desol in mixed electrolytes with different volume ratios of DMSO/N-MeIM (D/M) and NMP/TEA (N/T). Inset: photographs of lithium metal after soaking in the corresponding mixed electrolytes for 8 h. (c) Molecular dynamics simulation snapshots of DMC, DMSO, 4D-1M, and 4N-1T. (d) RDF and CN of the four electrolytes. (e) Calculated E_desol. (f) Arrhenius behavior and activation energies correlated with E_desol. (g) ⁷Li NMR spectra.
Why a 4:1 Ratio Was Chosen
The desolvation energy (E_desol) reflects the binding strength between solvent molecules and Li⁺. The authors evaluated it experimentally by fitting electrochemical impedance spectroscopy data from Li||Li symmetric cells at different temperatures. As shown in Figure 2b, E_desol increased monotonically as the content of high-DN solvent increased. However, when the high-DN fraction exceeded 20 vol%, lithium metal stability deteriorated. Based on this balance, the authors identified 4:1 as the optimal volume ratio for both mixed systems. Since DMSO has a slightly higher DN than NMP and more readily forms compact Li⁺ solvation structures, they selected DMSO as the single-solvent comparison case. They also chose DMC, a widely used solvent for Li/CFx batteries, as the control electrolyte.
For the lithium salt, the authors found that ionic strength is negatively correlated with battery voltage. To lower ionic strength while maintaining conductivity, they selected 0.5 M LiBF₄ because it enables rapid ion transport and supports good kinetics and rate capability. They finally prepared four electrolyte systems: 0.5 M LiBF₄ in DMC, 0.5 M LiBF₄ in DMSO, 0.5 M LiBF₄ in DMSO/N-MeIM, and 0.5 M LiBF₄ in NMP/TEA. These were denoted as DMC, DMSO, 4D-1M, and 4N-1T, respectively.
What the Solvation Analysis Revealed
Molecular dynamics simulations, together with radial distribution function (RDF) and coordination number (CN) analyses, showed that the addition of high-DN solvents reduced the number of anions in the first solvation shell and produced more compact Li⁺ solvation structures. Density functional theory calculations and experimental E_desol measurements supported the same conclusion. The calculated solvation energy increased in the order DMC < DMSO < 4D-1M < 4N-1T. The ⁷Li NMR spectra also shifted upfield as DN increased, which indicates stronger electronic shielding around Li⁺. Together, these results confirm that high-DN solvent environments create more compact solvation structures and stronger Li⁺–solvent interactions.
2.2 Influence of Li⁺ Solvation Structures on the Reaction Pathway of Li–CFx Batteries
The authors performed X-ray photoelectron spectroscopy measurements on CFx cathodes in DMC and 4D-1M electrolytes at different depths of discharge. They used fluorine-free LA133 as the binder so that the detected fluorine signals came only from the CFx cathode or the discharge product LiF. Before discharge, both DMC and 4D-1M cathodes showed the expected C–F and CF₂ peaks in the C 1s spectra and corresponding peaks in the F 1s spectra. The B–F fragment at 686.27 eV was attributed to adsorbed LiBF₄ salt from the electrolyte.
After discharge, Li–F peaks appeared in both DMC and 4D-1M and became stronger as DOD increased, while the C–F content gradually decreased. At 800 mAh g⁻¹, close to 100% DOD, crystalline LiF dominated the cathode. Importantly, in 4D-1M, the Li–F and C–F peaks shifted in opposite directions during discharge. This behavior supports the formation of the C[F⁻·Li⁺·Soln] intermediate and strongly suggests that the high-DN environment of 4D-1M delays premature decomposition of this intermediate. In DMC, which has a looser solvation structure, the intermediate decomposed more rapidly and LiF accumulated more quickly. The ratio of Li–F peak intensity to C–F peak intensity further confirmed that 4D-1M stabilized the intermediate and delayed its conversion into LiF. Raman data showed the same trend.
To further understand the discharge process, the authors conducted galvanostatic intermittent titration technique measurements by discharging the Li/CFx cells at 0.1 C for 20 minutes and then resting them for 1 hour. These measurements provided transient information about the reaction pathway and supported the conclusion that compact solvation structures stabilize the intermediate phase.
2.3 Heat Generation and Energy Redistribution
The authors then quantified heat generation and energy redistribution through solvation engineering. They performed ARC measurements and specific heat capacity tests on Li/CFx pouch cells. These data allowed them to compare the thermal output of DMC and 4D-1M systems directly.
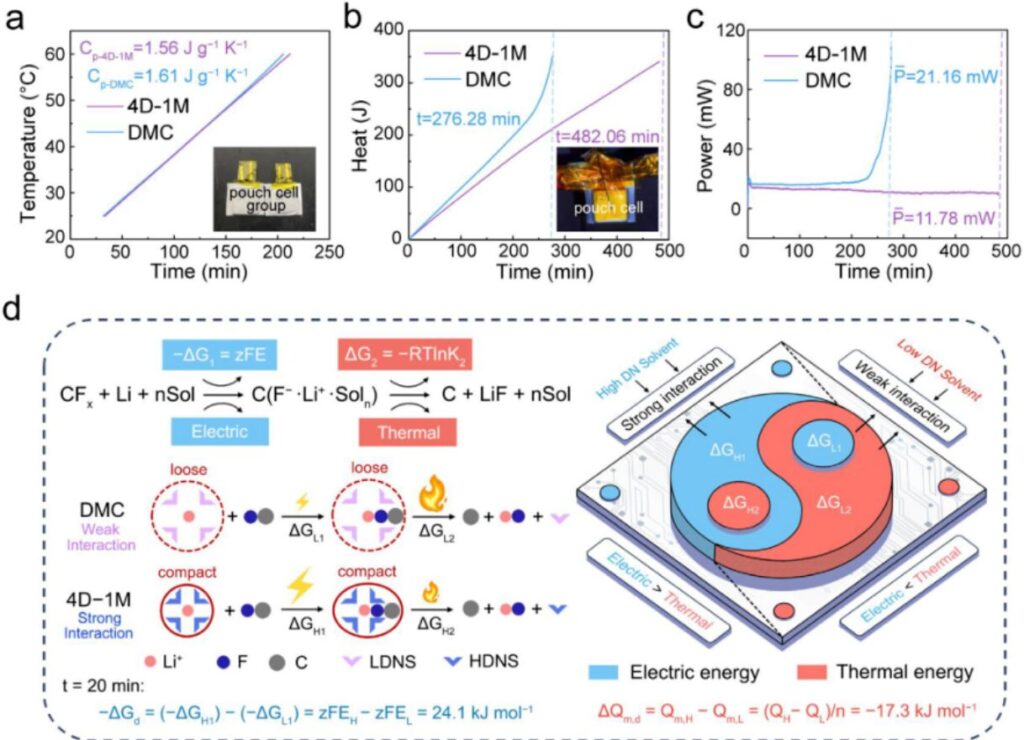
Figure 4. Quantifying heat generation and energy distribution through solvation engineering. (a) Discharge time and temperature variation curves from ARC tests used to estimate specific heat capacity. (b) Heat generation curves during discharge of Li/CFx pouch cells. (c) Heat generation power. (d) Schematic illustration of the influence of Li⁺ solvation structures on electrical energy and heat generation during discharge.
The specific heat capacity of the DMC-containing pouch cell was 1.61 J·g⁻¹·K⁻¹, slightly higher than that of the 4D-1M pouch cell, which was 1.56 J·g⁻¹·K⁻¹. Based on these measurements, the authors estimated the average total heat generation during discharge. The value was 350.74 J for DMC and 211.70 J for 4D-1M. The corresponding average heat generation powers were 21.16 mW and 11.78 mW, respectively. They also calculated the Gibbs free energy difference and the heat generation difference between DMC and 4D-1M. At a discharge time of 200 minutes, –ΔG_d and ΔQ_m,d were 24.1 kJ mol⁻¹ and –17.3 kJ mol⁻¹, respectively. In addition, Joule heat accounted for only 1.17% of the total released heat. This shows that the thermal difference mainly came from reaction thermodynamics rather than simple resistive heating. Overall, these results provide direct evidence that the compact solvation structure in 4D-1M suppresses heat generation and redirects more energy into electrical output.
2.4 Comparison of the Discharge Behavior of Li/CFx Batteries with Different Electrolytes
Rate Performance in Coin Cells
Figure 5a compares the discharge voltage curves of Li/CFx coin cells at 0.01 C. All curves show a single voltage plateau that corresponds to intermediate formation. The output voltage increased with solvent DN, following the order DMC (2.52 V) < DMSO (2.85 V) < 4D-1M (2.90 V) ≈ 4N-1T (2.92 V). Notably, the discharge capacity was not sacrificed. In fact, it slightly increased with the use of HDNS-type electrolytes.
The influence of solvent DN became even more pronounced at higher rates. In 4D-1M, the cells delivered 2.90 V at 0.01 C, 2.73 V at 0.1 C, 2.61 V at 1 C, and 2.25 V at 5 C. In 4N-1T, the corresponding voltage plateaus were 2.92 V, 2.80 V, 2.56 V, and 2.20 V. At 5 C, the 4D-1M and 4N-1T cells still retained capacities of 775.1 and 642.3 mAh g⁻¹, respectively. By contrast, the low-DN electrolytes DMC and DME showed rapid capacity fading and much lower voltage. The authors also compared commercial electrolytes such as 1 M LiPF₆ in EC/DEC and 1 M LiBF₄ in PC/DME. These delivered lower voltage plateaus than 4D-1M and 4N-1T under the same conditions.
Performance Under Lean Electrolyte and High Loading
The optimized systems also showed good high-temperature adaptability, working from 40 to 80 °C with elevated discharge voltage due to enhanced kinetics. Under lean-electrolyte and high-loading conditions, the 4D-1M and 4N-1T cells still outperformed DMC. Their storage stability was also strong. After one day and even three months of rest, the cells maintained a capacity retention of 97.4% with negligible voltage decay. Even at lean E/C ratios of 1.76 μL and 1.97 μL mAh⁻¹, the cells still showed impressive discharge performance.
Morphology Evolution of LiF
Scanning electron microscopy and transmission electron microscopy were used to examine how solvent–Li⁺ interactions affected the precipitation of LiF. XRD confirmed that LiF was the only final discharge product after full discharge, regardless of the electrolyte. As solvent DN increased, both the size and coverage of LiF decreased. In DMC, LiF appeared as dense cubic nanoparticles with sizes of 50–100 nm. In DMSO, LiF became rice-like and better dispersed, with smaller sizes of 5–10 nm. In 4D-1M and 4N-1T, the LiF particles became even smaller and more dispersed, often below 5 nm. These results support the idea that compact solvation structures delay intermediate decomposition and lead to finer LiF products, which in turn help maintain electron and Li⁺ transport within the cathode.
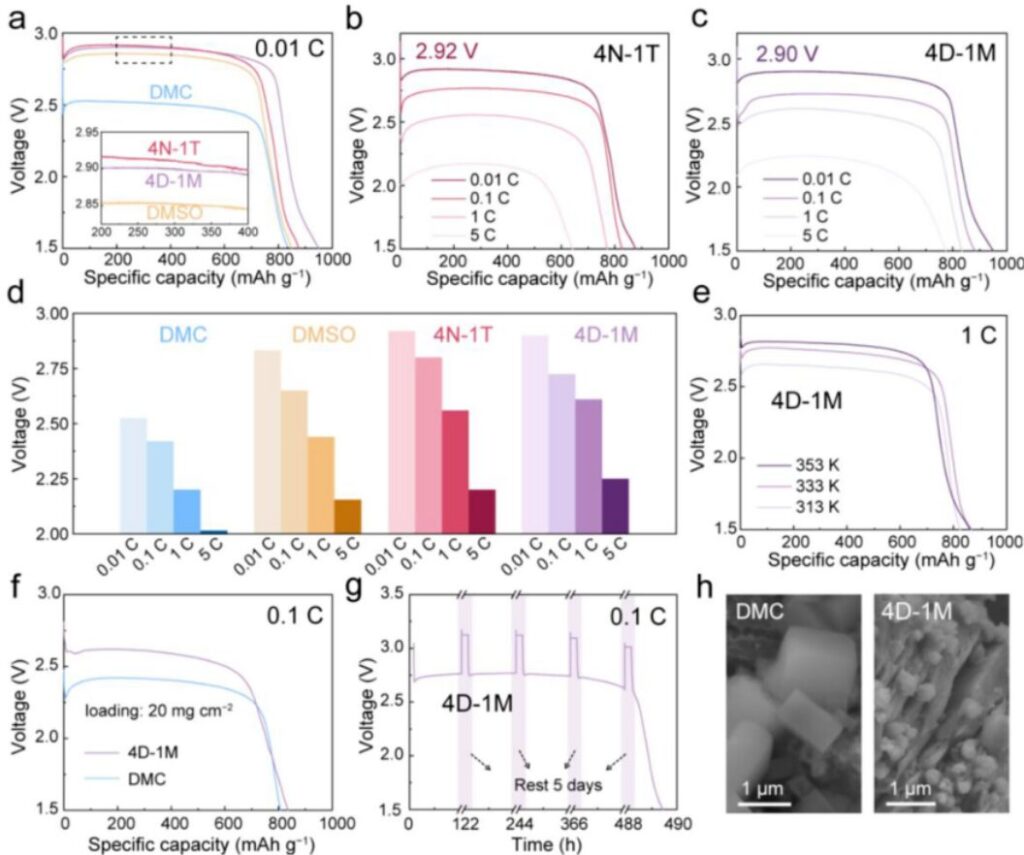
Figure 5. Discharge behavior of Li/CFx batteries under different electrolyte conditions. (a) Discharge voltage curves at 0.01 C. (b) Discharge voltage curves in 4N-1T at different rates. (c) Discharge voltage curves in 4D-1M at different rates. (d) Comparison of discharge voltage at different rates. (e) Voltage curves in 4D-1M from 40 °C to 80 °C. (f) High-loading Li/CFx cells in DMC and 4D-1M. (g) Intermittent-rest discharge curves in 4D-1M. (h) SEM images of discharged CFx cathodes in DMC and 4D-1M.
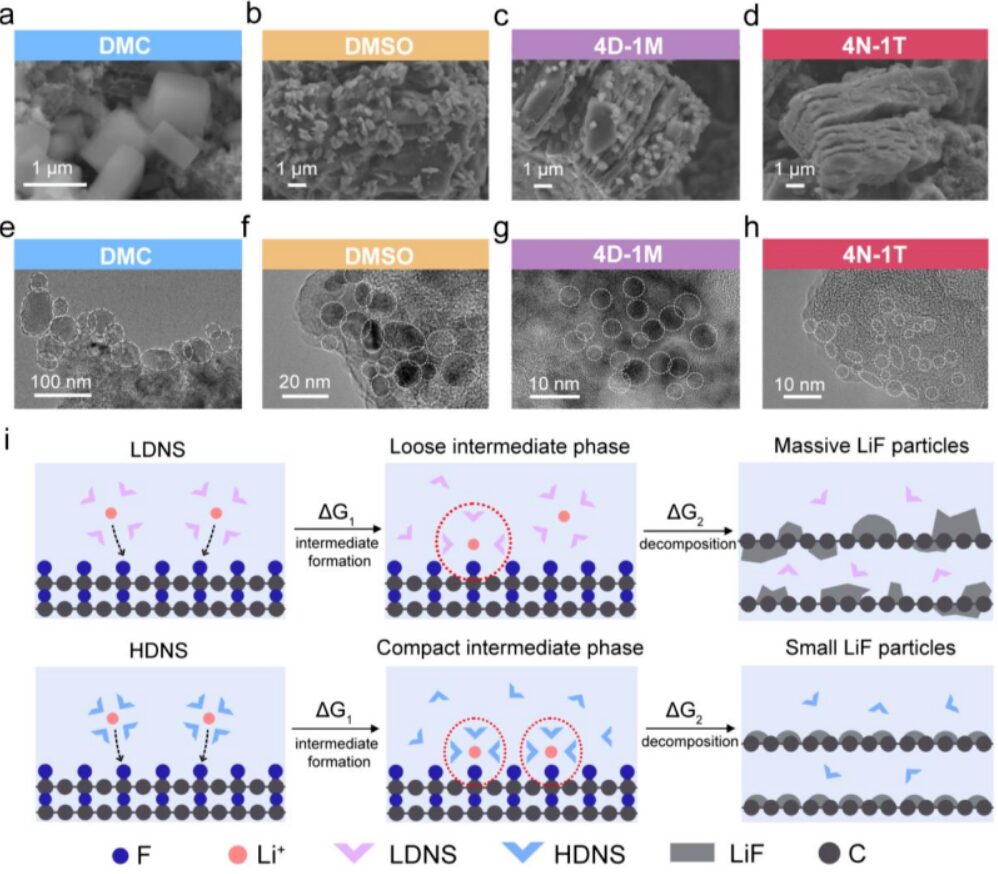
Figure S29. SEM images of the CFx cathodes after discharge to 1.5 V at 0.1 C in (a) DMC, (b) DMSO, (c) 4D-1M, and (d) 4N-1T; TEM images of the CFx cathodes after discharge to 1.5 V in (e) DMC, (f) DMSO, (g) 4D-1M, and (h) 4N-1T. (i) Schematic illustration of the LiF formation process in liquid dual-ion electrolytes and highly coordinated dual-ion electrolytes, shown in the upper and lower panels, respectively.
2.5 Evaluation of the Energy Density of Ah-Level Li/CFx Pouch Cells in 4D-1M
600 mAh Pouch Cell Demonstration
The excellent electrochemical performance and effective thermal suppression of the mixed electrolytes encouraged the authors to build practical Li/CFx pouch cells for larger-scale validation. A 600 mAh pouch cell using 4D-1M produced a stable discharge plateau of about 2.80 V, which was far higher than the roughly 2.20 V plateau observed in DMC. Two pouch cells connected in series could charge a mobile phone, showing the potential of this chemistry for high-energy applications. In addition, pouch cells using 4D-1M and 4N-1T powered water electrolysis and generated abundant bubbles with a stable current density of about 33.2 mA cm⁻², much higher than DMC.
6 Ah, 10 Ah, and 20 Ah Pouch Cell Results
To reduce the possible influence of 4D-1M on the lithium metal anode, the authors paired commercial CFx with LiB alloy foil in the Ah-level pouch cells. At 0.01 C, the 6 Ah cell delivered 2.90 V and 5.87 Ah, the 10 Ah cell delivered 2.92 V and 9.68 Ah, and the 20 Ah cell delivered 2.90 V and 19.17 Ah. These values correspond to energy densities of 816, 820, and 830 Wh kg⁻¹ based on the full cell weight, including packaging. Importantly, the LiB alloy anode showed no obvious corrosion after discharge, which indicates good compatibility with the optimized electrolyte. According to the authors, this strategy produced the highest-capacity and highest-energy-density CFx-based pouch cells reported to date.
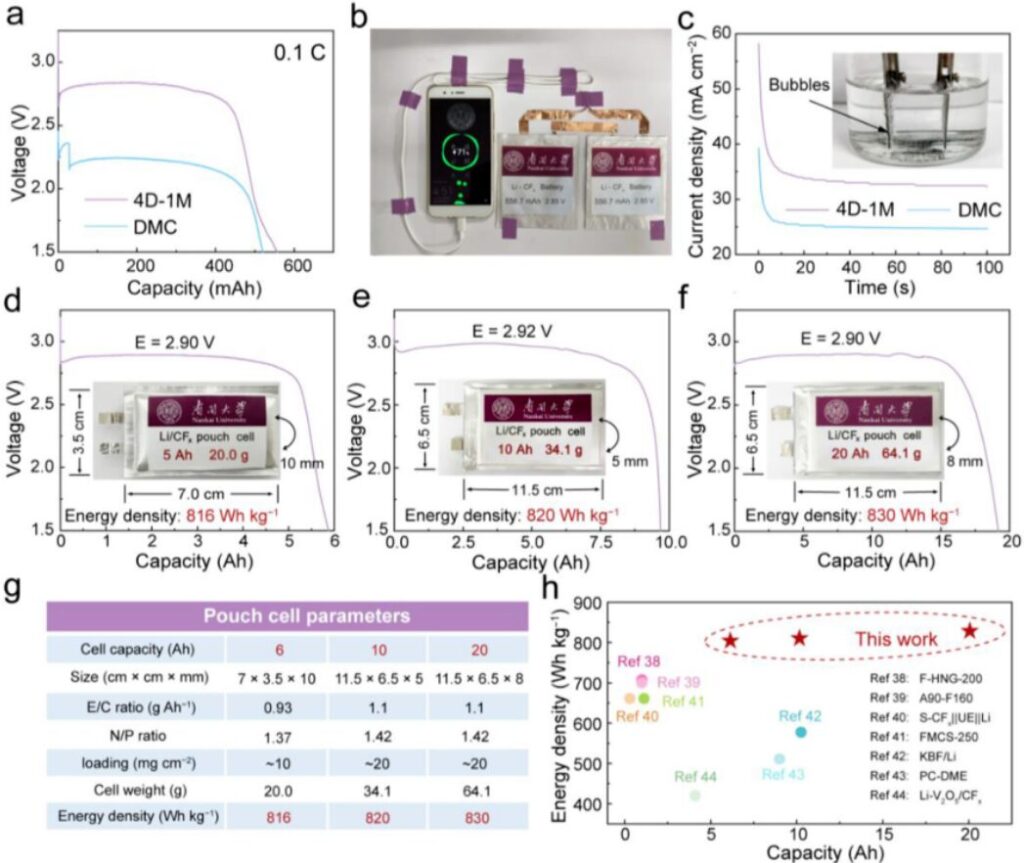
Figure 6. Discharge performance of Li/CFx pouch cells. (a) Discharge curves of 600 mAh pouch cells in DMC and 4D-1M. (b) Photograph of two pouch cells charging a mobile phone in series. (c) Current density–time curve for water electrolysis powered by Li/CFx pouch cells. (d) 6 Ah pouch cell discharge curves. (e) 10 Ah pouch cell discharge curves. (f) 20 Ah pouch cell discharge curves. (g) Pouch cell parameters. (h) Comparison of energy density with previously reported Ah-level CFx pouch cells.
Summary and Outlook
The authors analyzed the discharge process of Li/CFx batteries and showed that the conversion of chemical energy from the C[F⁻·Li⁺·Soln] intermediate into heat is a major reason for heat generation and discharge voltage loss. To address this issue, they screened a series of solvents to obtain stronger Li⁺ interactions and delay the decomposition of the intermediate. This strategy maximizes the conversion of chemical energy into electrical energy and suppresses heat dissipation. As a result, it raises the discharge voltage and improves battery safety.
Experimentally, the authors formulated two binary solvent systems that create compact Li⁺ solvation structures. These mixed electrolytes reduced heat generation by about 40% compared with DMC. At 0.01 C, the optimized electrolyte enabled Li/CFx batteries to deliver 2.90 V and 949.2 mAh g⁻¹, clearly outperforming the DMC-based cells. In addition, the 5 Ah, 10 Ah, and 20 Ah Li/CFx pouch cells all maintained voltage plateaus close to 2.90 V and achieved energy densities of 816–830 Wh kg⁻¹. These values represent the highest reported energy density for CFx-based pouch cells so far.
Experimental Methods
Electrolyte Preparation
All electrolytes were prepared in an argon-filled glovebox with H₂O < 0.1 ppm and O₂ < 0.1 ppm. For single-solvent systems, the authors dissolved 0.5 M LiBF₄ in DMC or DMSO. For binary-solvent systems, they dissolved 0.5 M LiBF₄ in mixed solvents with different volume ratios.
Preparation of CFx Cathodes
The authors prepared the CFx cathodes by mixing commercial CFx powder, Super P carbon black, and PVDF in a mass ratio of 8:1:1 and dispersing the mixture in NMP to form a uniform slurry. They coated the slurry onto carbon-coated aluminum foil and dried it under vacuum at 80 °C for 12 hours. The average loading for coin cells was 1.5–2 mg cm⁻². For high-loading cathodes of 15–20 mg cm⁻², they used a mass ratio of 9:0.5:0.5 for CFx, Super P, and PVDF. The 6 Ah pouch-cell cathodes were prepared using a similar process, except that the electrodes were double-side coated and produced by a roll-to-roll process. For XPS testing at different depths of discharge, the authors used fluorine-free LA133 binder to eliminate interference from fluorine.
Automatic Film Coater with Integrated Drying System(XN-VCH-300)